Follow Us
Debugging Techniques
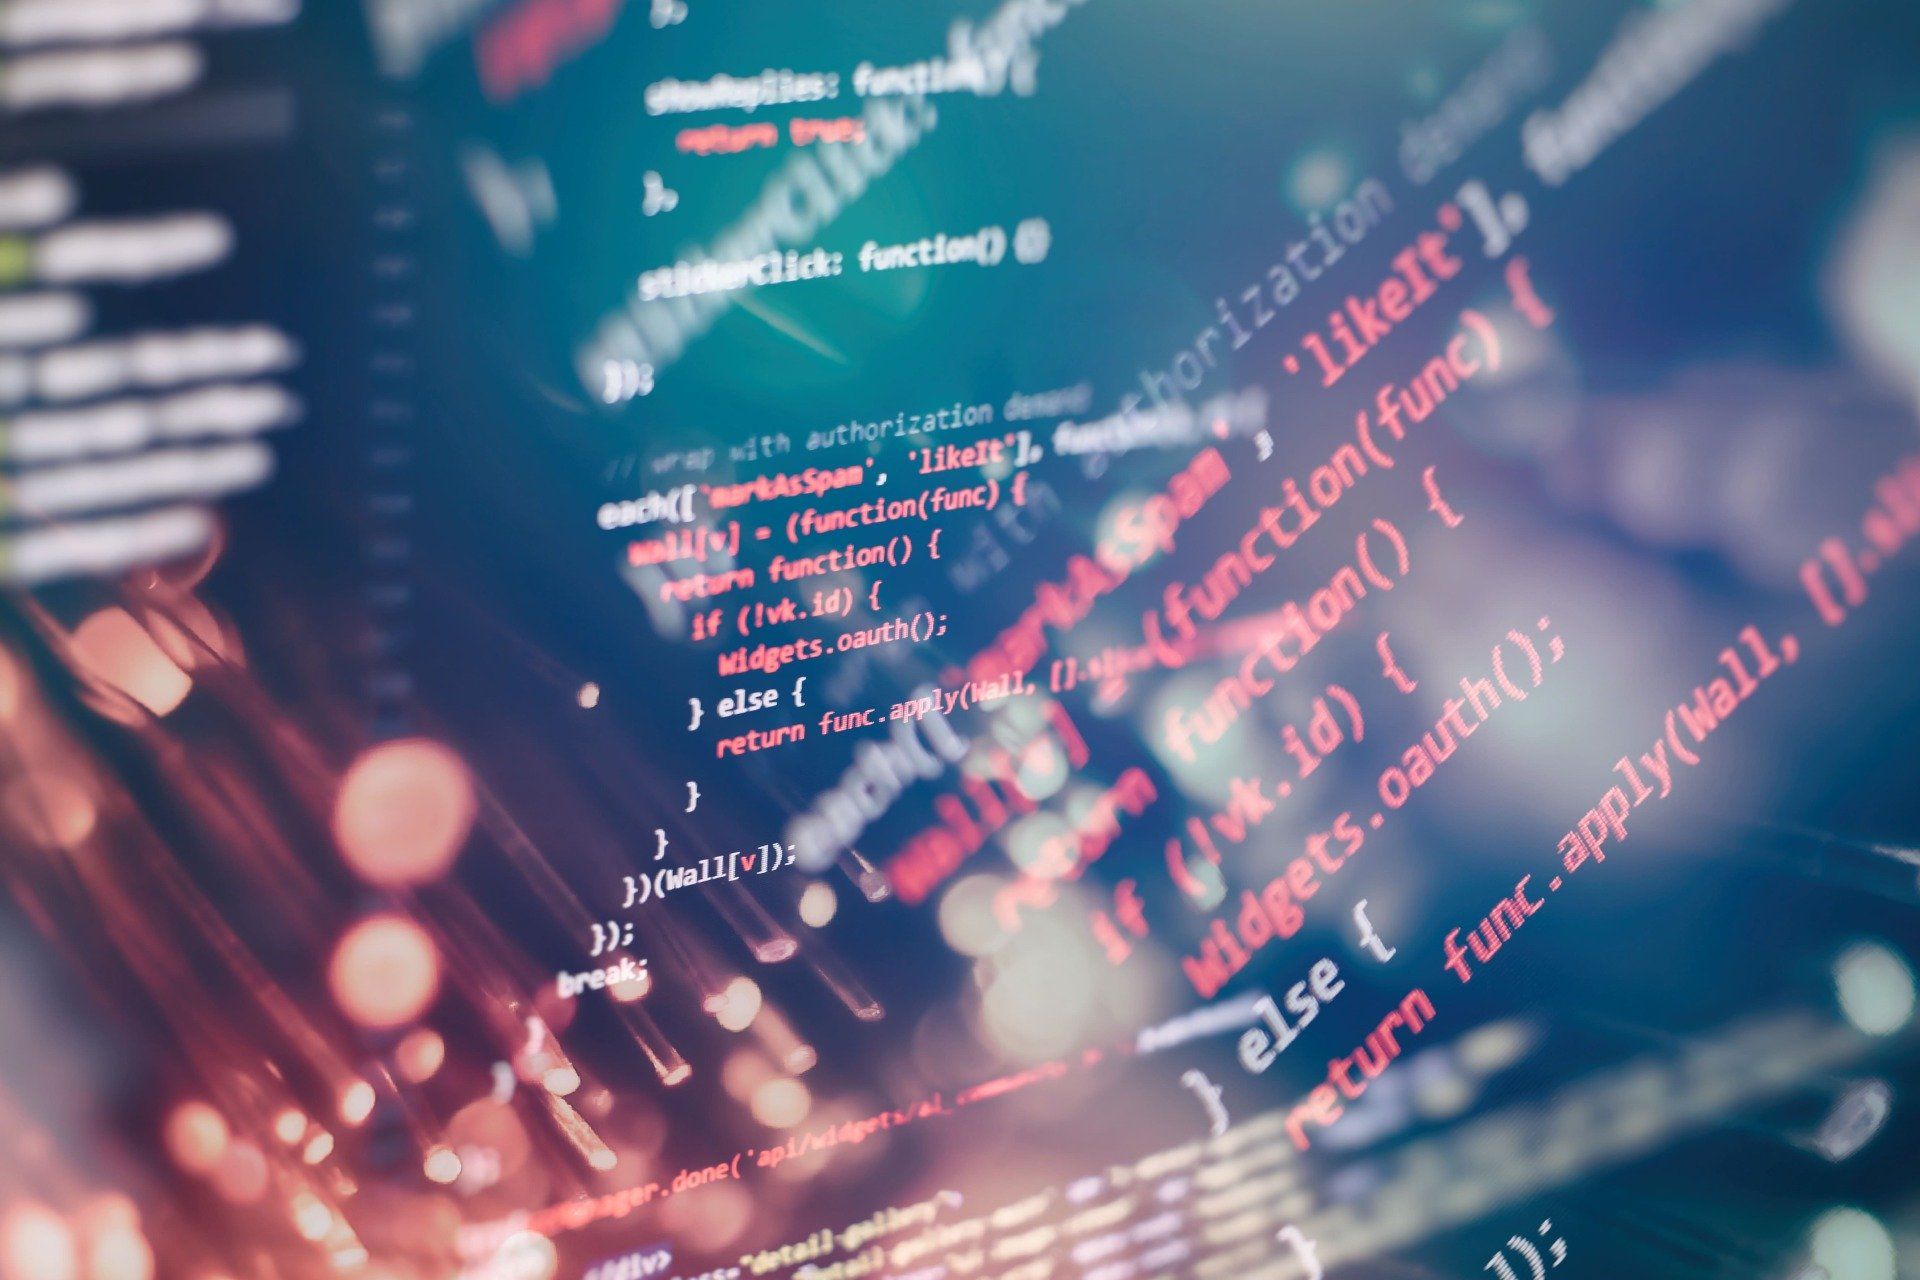
Debugging software is critical to the software development process. It is used by software developers to find bugs, analyse bugs, and improve the quality and performance of their software. Manual debugging is a difficult and time-consuming process for resolving bugs. By setting breakpoints, we can learn about the programme, how it works, and what causes errors.
Once the code has been written, it is combined with other programming phases to create a new software product. The large programme is debugged using a variety of techniques, including unit tests, code reviews, and pair programming (which contains thousands of lines of code). Determining the code's logging and error messages are made easier by the standard debugger tool or the debug mode of the integrated development environment (IDE).
What Procedures Are Involved in Software Debugging?
There are five steps involved in the development of software debugging:
- A defect report is made after the system's bug is found. The developer can analyse the problem and find solutions with the aid of this report.
- The debugging tool is used to identify the bug's root cause and conduct a step-by-step execution process analysis.
- We must implement the necessary changes to address the problems once the bug has been located.
- During the debugging software process, the software is retested to make sure that no errors are still present, and that all new errors are checked.
- The software process used a sequence-based approach that made it simpler and more convenient for the developer to identify bugs and fix them using code sequences.
Debugging Techniques
The debugging process can be carried out quickly and effectively by adhering to a few guidelines. The most popular debugging techniques are:
Using a backtracking strategy and testing to debug.- Using force to debug.
- An induction strategy.
- A deduction strategy.
Finding errors in small programmes is done using the backtracking strategy. To identify the source of a bug or error when it occurs, the programme is traced one step backwards during the evaluation of values.
The method of debugging that is most often used is brute force. This is accomplished by analysing memory dumps from the programme, which contain a significant amount of information with intermediate values. However, the time and energy spent on information analysis and bug discovery are wasted.
The location of pertinent data, data organisation, the devising hypothesis (which offers potential error causes), and the proving hypothesis are all components of the induction strategy. Whereas a deduction strategy comprises determining potential bugs or hypothesis causes elimination of potential causes utilising the knowledge Improvement of the premise ( analysing one-by-one).
Testing is used in conjunction with the debugging techniques of induction and deduction. Test cases used during the debugging process are distinct from those used during the testing process.
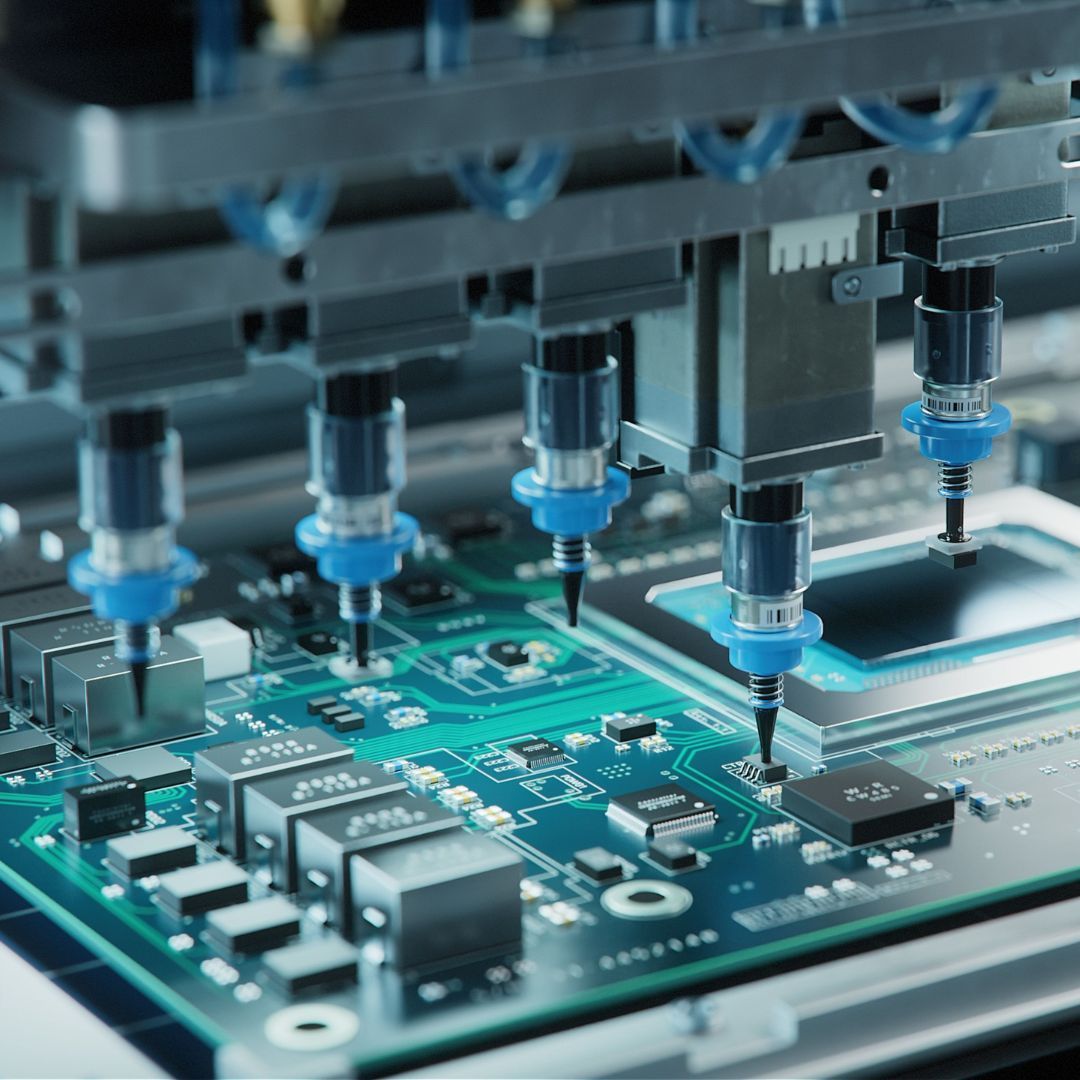
Techniques for Debugging Embedded Systems
These methods improve the code's quality and functionality while lowering the number of errors. The use of virtual memory and physical memory addresses is essential for embedded system debugging.
An embedded system uses 6 debugging techniques:
- Streamline the complex data.
- Divide and conquer.
- Elongate the procedure.
- Alter only one variable at a time.
- Off-line models are created
- Begin from a known-good state.
Different debugging methods are employed in various situations. Combining one or more strategies may result in mistakes. This procedure entails:
- Reproduce the flaw or issue.
- Describe the bug using the user’s input.
- When a bug first appears, try to gather all the variable values and the program's state.
- Determine the bug's cause by analysing the issue.
- Fix the issue and look into all potential causes of future issues.
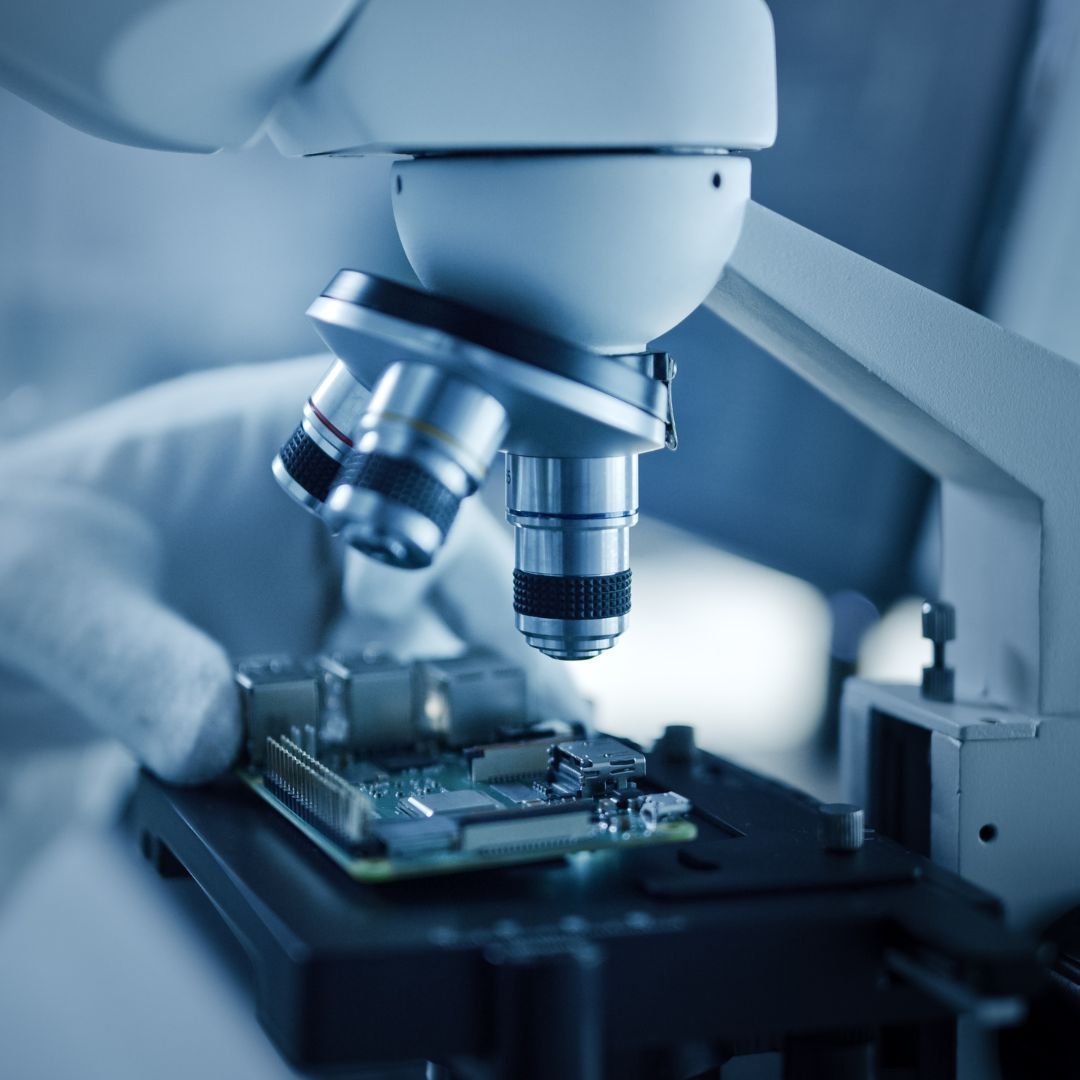
Using M-Tek Assembly for Your Debugging Issues
Looking for low-cost, high-quality printed circuit boards as well as debugging? Then you've come to the right place. Here at M-Tek Assembly Ltd, we have extensive industry knowledge, and our group of talented engineers will walk you through every step. Using M-Tek to repair printed circuit boards will also help the environment. By using electric vehicles, we have reduced our carbon footprint to zero, and for every circuit board we produce, a tree is planted. For assistance, get in touch with one of our SMT and PCB assembly experts right away.
To find out more about our services, call 01189 455377 or follow us on Twitter.
Recent Posts
Share This Post
Leave A Comment
Call Our Team
Want to find out more about our PCB assembly services? Speak to our team to find out how we can help you.

M-Tek Assembly. A Specialist Full Turnkey Electronic Manufacturing Partner. Full Procurement, Assembly, X-RAY, Programming & Test Services
